
StockAlgos - AI-Powered Stock Research Pipelines | Build Multi-Step AI Workflows
#2 PRODUCT OF THE WEEK Fintech

Build Multi-Step AI Workflows for Stock Research

The market rewards people who know first. AI-researched market insights, delivered straight to your inbox.
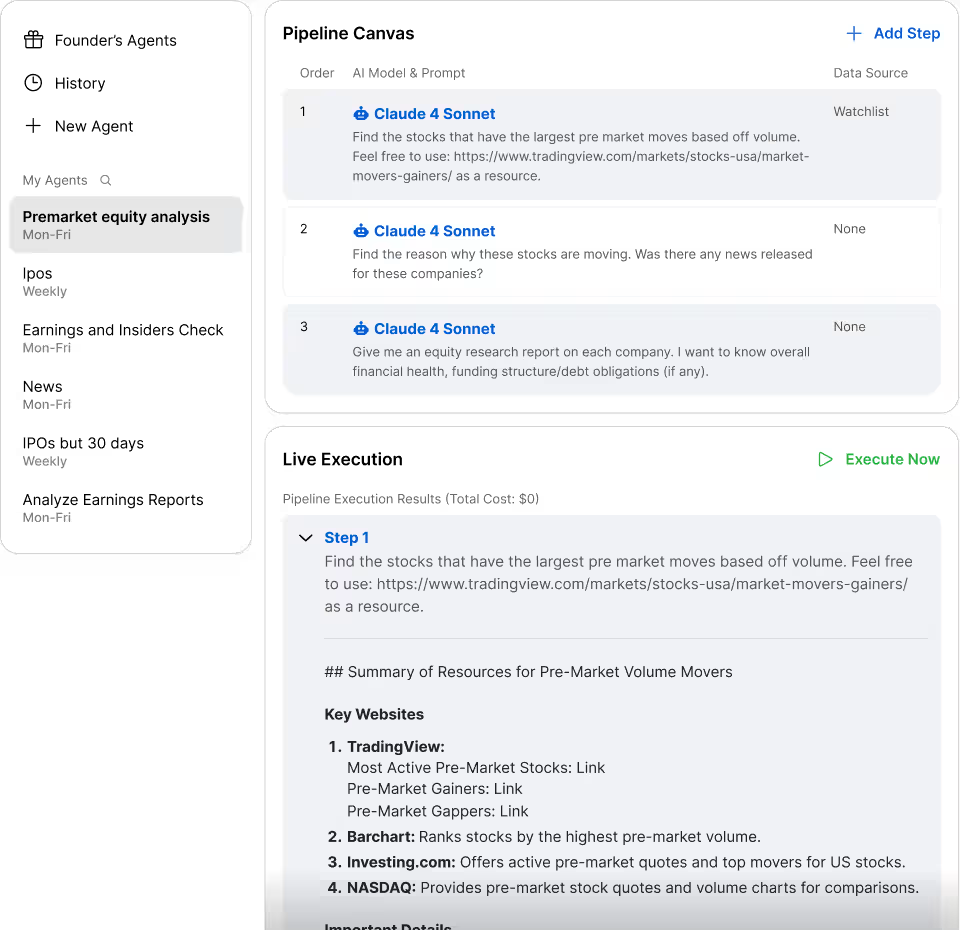
  • 10+ AI Models
  • 11 Data Sources
  • No Code Required
Agentic Tool Pipeline Builder

Understand why daily AI market
updates are essential

Subscribe to pre-built agents or create your own custom pipelines

Spot Opportunities Before the Crowd

AI detects early market movers and emerging trends — giving you an advantage before momentum builds

10+ AI Models to Choose From

Pick the right AI for each task: Claude Sonnet 4, GPT-4o, Gemini, and more. Balance intelligence, cost, and speed

Avoid Costly Mistakes

With consistent signals and context, you’ll know when to step back and protect your capital

Cut Through Market Noise

Skip the endless opinions - get concise, data-driven insights focused only on what truly matters

Stay Consistently Informed

Markets evolve every day. Daily updates keep you aligned with the most relevant shifts

Get Started Free

How It Works: Build a 3-Step
Analysis in Minutes

No coding required. Just configure steps and let AI do the research.

Set Up Your Search

Choose from 11 real-time data sources — insider trades, earnings, congress activity, and more. Tell the AI exactly what to look for using plain English prompts.
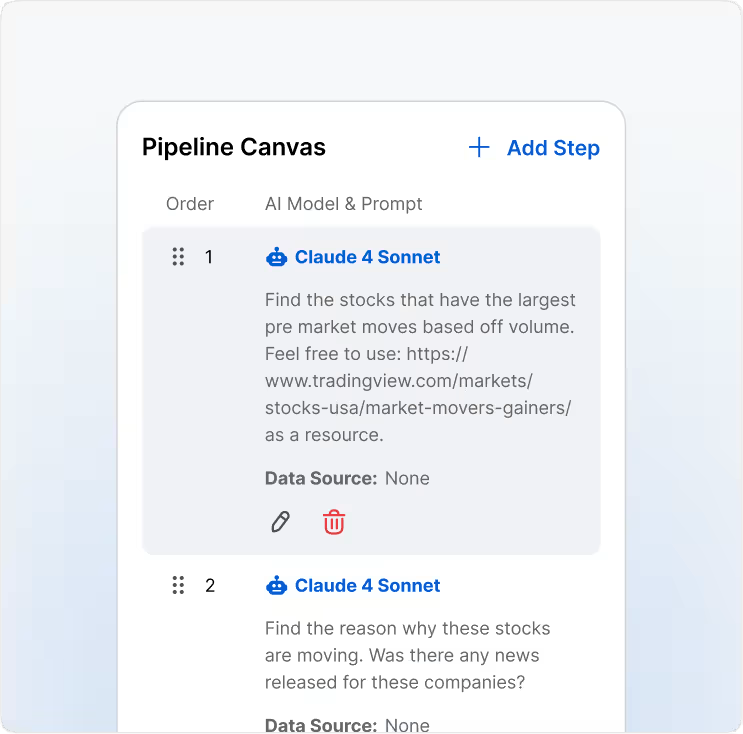
Add Analysis Steps

Stack multiple AI models in sequence — use Claude for deep analysis, then GPT-4o for a concise summary. Each step builds on the last, just like a research team would.

Run or Automate

Execute instantly or schedule your pipeline to run daily, weekly, or monthly. Results are delivered straight to your inbox — no manual work needed.

Pre-Built Founder's Agents

Skip the setup. Subscribe to professionally-designed AI agents that run fixed pipelines daily,
combining market data, prompts, and AI models to deliver consistent insights.
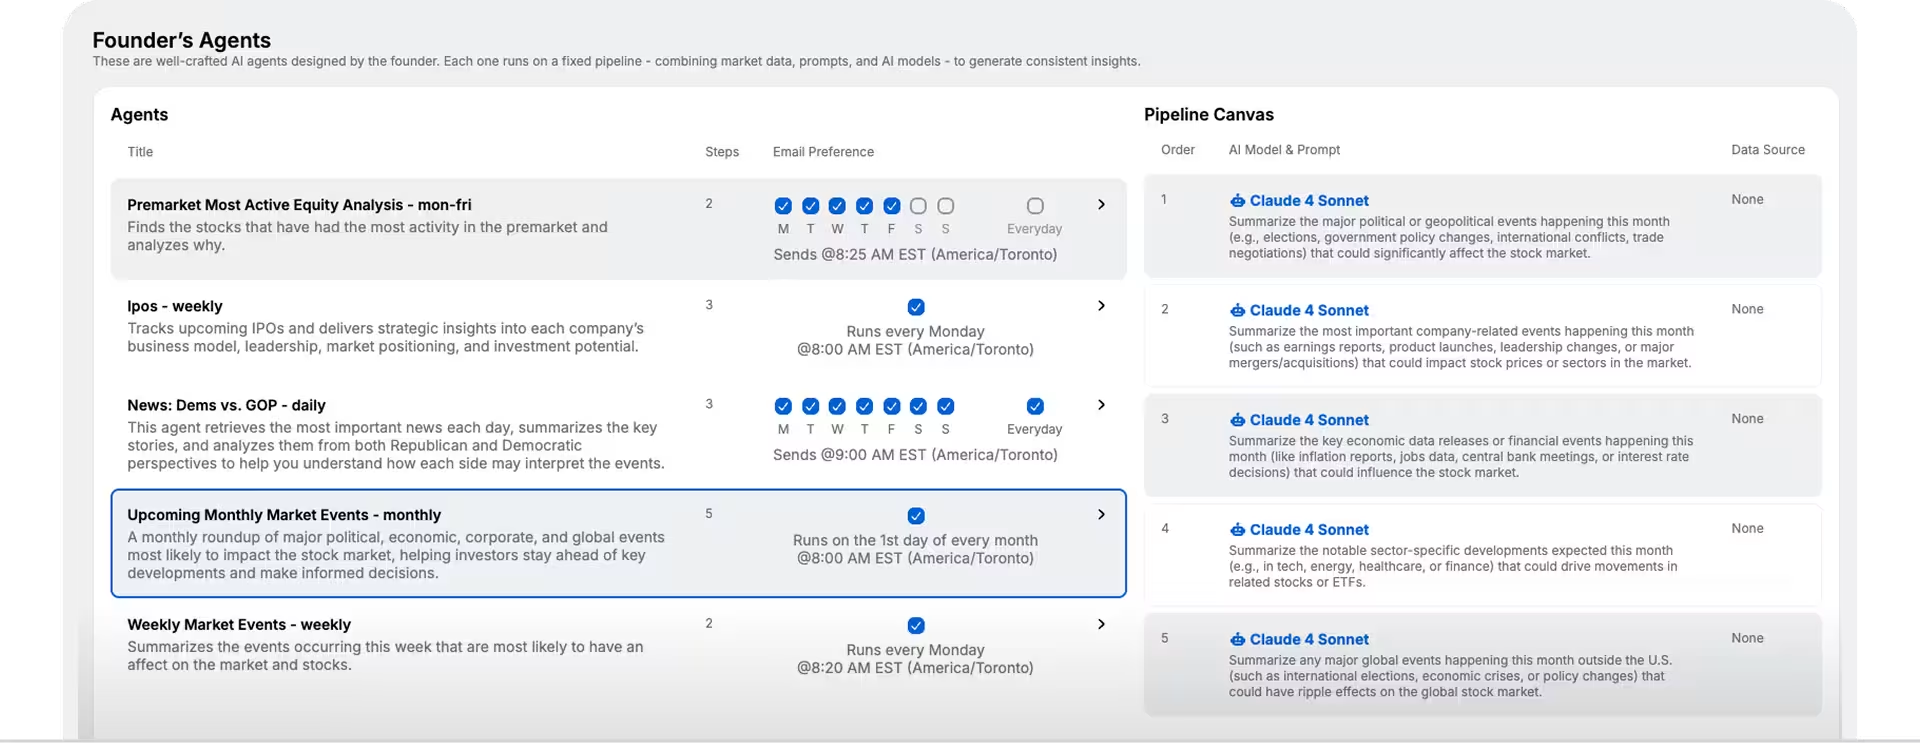
Founder's Agents Dashboard

Weekly Free Tier

Get one AI-generated market update every Monday at no cost

Daily Pro Updates

Upgrade to $11/month for daily insights 5 days a week (on sale, was $30 )

Full Archive Access

Browse all past AI-generated reports to understand trends over time

Try the Pipeline Builder

Real AI-Generated Analysis
Examples

This is the actual output from the free weekly report we send out every Monday.

Weekly Market Calendar

Monday, July 6, 2026

Analysis Results

Step 1: Pull the latest US economic indicators: CPI and the inflation trend, the federal funds rate, the full Treasury yield curve (3M through 30Y) and its inversion read, the unemployment rate, nonfarm payrolls, retail sales, durable goods orders, and real GDP. Report each with its latest reading and the change versus the prior period. Report ONLY the series present in the returned dataset — do not list absent series as 'missing' or 'not provided'; the VIX, jobless claims, and consensus values are handled by the web-research steps. These latest readings are the PRIOR values for this week's scheduled releases — the calendar step must use them to fill its Prior column with real numbers.

Step 2: Search authoritative financial news and economic calendars (Bloomberg, Reuters, CNBC, MarketWatch, Investing.com, Fed website, official government data release schedules) for this week's calendar (Monday through Friday). Cover, in priority order: 1. **US Economic Data Releases (highest priority):** for each day, every scheduled release with exact time (ET), the prior reading, and the consensus expectation (CPI, PPI, jobs data, GDP, retail sales, PMI, housing data, consumer confidence, etc.). For prior values, use the real latest readings pulled in the previous step wherever they correspond; get consensus expectations from your searches. 2. **Central Bank Activity:** Fed speeches, FOMC minutes, rate decisions; note ECB, BoJ, BoE, or PBoC activity only where plausibly market-moving for US equities. 3. **Geopolitical/Political:** elections, trade policy developments, sanctions, or political events this week that could move markets. 4. **Market tone:** the current VIX level and the general tone heading into the week. For each item include: date, time, event name, prior value, expected value, and importance level (High / Medium / Low). Do not leave Prior/Consensus columns empty — search until you find the values or explicitly mark a specific value as unavailable. Preserve every number exactly.

Step 3: Pull the earnings calendar for the upcoming week (Monday through Friday). For each company reporting: ticker, company name, report date, report time (before/after market), expected EPS and revenue consensus, and the average historical earnings-day move where available. Sort by market cap descending and flag the 10 most market-moving reports of the week.

Step 4: Search the web for major corporate and regulatory events happening this week beyond earnings (the earnings calendar was already pulled in the previous step — do not re-collect it): **Corporate Events:** product launches, investor days, major conferences (e.g., JPMorgan Healthcare, CES), analyst days, stock splits, index reconstitutions, or IPO pricings. **Regulatory/Legal:** antitrust rulings, SEC actions, or legal decisions affecting major companies. For each event: company, ticker, date, event type, and a brief description of the expected impact, with sources.

Step 5: Pull current quotes and one-month price history for these index ETFs: SPY, QQQ, IWM, DIA. For each, report: last close, 1-day change, 1-month change, the one-month high and low, and how far the current price sits from that high and low (in percent). These are the real levels the final playbook must use for its market context — do not editorialize here.

Step 6: Using the economic calendar, earnings calendar, corporate events, index ETF levels, and macro readings from the previous steps, create the Weekly Market Calendar email: **Week at a Glance** — 3-sentence summary of the most important themes this week. **Day-by-Day Playbook:** For each day (Monday through Friday), a maximum of 3 tight bullets: the key events and releases, what to watch for, and which sectors/stocks are most exposed. **Top 3 Events of the Week:** The three most market-moving events. For each: - What consensus expects - Bull case (better than expected) and bear case (worse than expected) scenarios - Which stocks/sectors benefit or suffer in each scenario - How to position **Market Context:** Use the actual index ETF levels pulled earlier (last close, distance from one-month highs/lows), the yield readings from the macro step, and the VIX if a current reading was found by the web-research steps. Describe trend and positioning from those real numbers — do NOT invent precise support/resistance levels beyond them. **Positioning Take:** Brief (3-5 bullet) actionable view: risk-on or risk-off? Sector tilts? Any hedging considerations? Format as a clean, scannable email with clear section headers. Be selective, not exhaustive — the whole email must stay under roughly 2,500 words. EMAIL QUALITY — your output IS the entire email a paying subscriber receives. It must read as a standalone, professional market brief: - Never reference pipeline internals in the output: numbered steps, 'the previous step', passes, data sources, tools, feeds, field names like security_type_hint, retrieval status, or whether any part of the process was or wasn't completed. The reader must never see how the brief was assembled. - If a section, table row, or data point has no real content, omit it entirely — do not write placeholders like 'no data found', 'not retrieved', 'not provided', 'N/A', or 'none available'. A missing section is invisible; a placeholder is unprofessional. - Never include excluded-securities housekeeping (warrants, units, rights, preferreds, leveraged ETFs/ETNs) in the brief — that triage is internal working data. - Where something genuinely could not be verified or explained, present it as reader value (e.g. a brief 'watch for delayed news' note or an 'unverified' label on a single figure) — never as a report on what your research process failed to do.

Simple, Transparent Pricing

No credit card required to start. Get weekly AI market updates and 10 credits
to build custom pipelines — upgrade anytime for daily insights.

Free Tier

$0

Start for free
What's included?
  • Weekly AI market update (Mondays)
  • 10 free credits for custom pipelines
  • Access to Pipeline Builder
  • 10+ AI models to choose from
  • 11 real-time data sources
  • Execution history & archive
Create Your Own Agents

Every account starts with 10 free credits. Use them to build and test custom research agents. When you run out, simply recharge with more credits.

Contact us if you have any questions

10+

AI Models Available

11

Real-Time Data Sources

5x

Weekly Market Updates (Pro)

#2

Product Hunt Fintech

Frequently Asked
Questions

Contact us if you have any questions

Credits are used to run custom pipelines. Each execution costs credits based on the AI models you choose and the number of tokens processed. More powerful models cost more credits. You can track exact costs per pipeline in real-time.

You have access to 11 real-time data sources: Insider Trades, Congress Trades, Earnings Reports, FDA Approvals, IPOs, Patents, Dividends, Fundamentals, Correlations, and custom Watchlists.

Yes! Each step in your pipeline can use a different AI model. For example, use Claude Sonnet 4 for deep analysis, then GPT-4o-mini for quick summaries. Mix and match based on your needs.

Absolutely. Save any pipeline as an "Agent" and schedule it to run daily, weekly, or monthly. Results will be emailed to you automatically at your preferred time and timezone.

Community & Interaction

Research is better when it sparks ideas

Don’t just read the insights — be part of the conversation. At Predictr.ca, you can share your own stock predictions, see how others are thinking, and learn from different perspectives.
Additionally, win prizes for top three predictors every month.
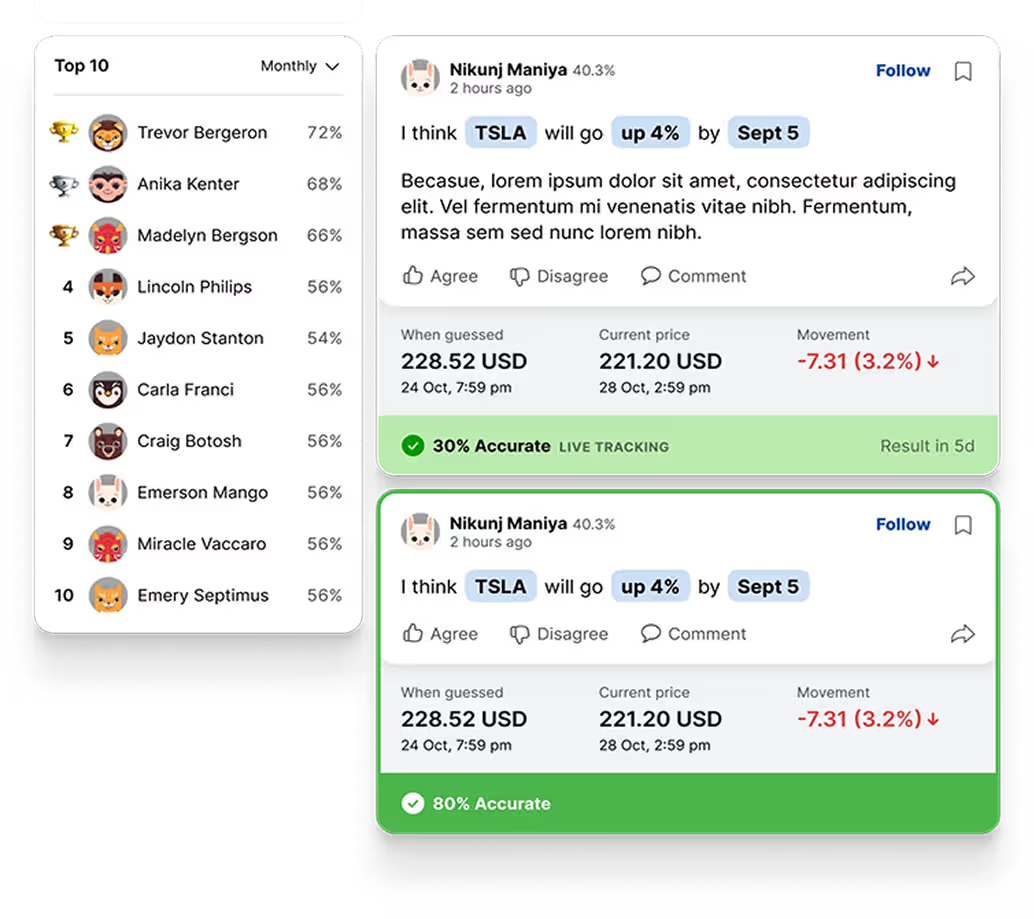
Visit Predictr

Stop Doing Manual Research.
Build AI Pipelines Instead.

Join traders who use AI to spot opportunities before the crowd.
Build your first multi-step workflow in under 5 minutes.

Get Started Free

No credit card required • 10 free credits • Cancel anytime